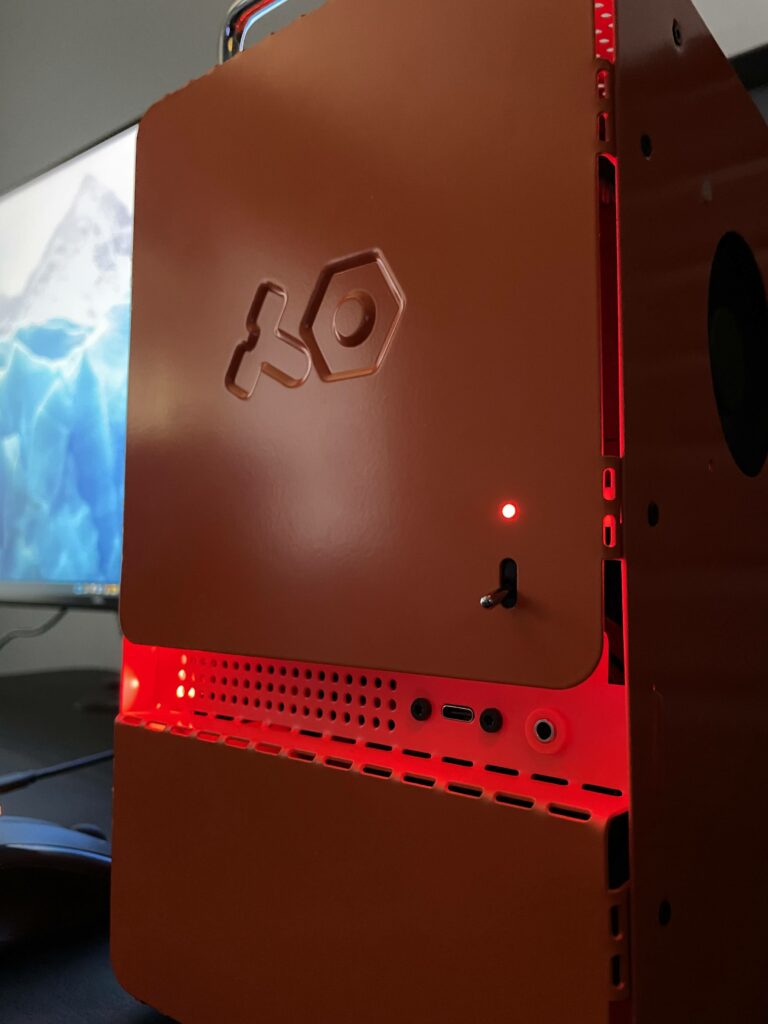
If the objective was to make the robot less creepy, I’ve failed miserably.

Much like the first time I laid eyes on flip dots, when I learned of the computer-1 Mini-ITX case by Teenage Engineering I knew I had to get my hands on it. Maybe I have a thing for bright orange objects.
It’s been a few years since I built my previous PC and the Mini-ITX form factor has always been appealing to me for a workstation, so the hankering to do a new build was strong.
Though I’m a long time nerd it may be surprising that I’ve really only built one custom PC until now. This is mostly due to living in Mac-land and not being a hardcore gamer. My Linux servers have either been in the cloud or a leftover prebuilt that was “good enough” because Linux will pretty much run on anything (and that’s part of the fun).
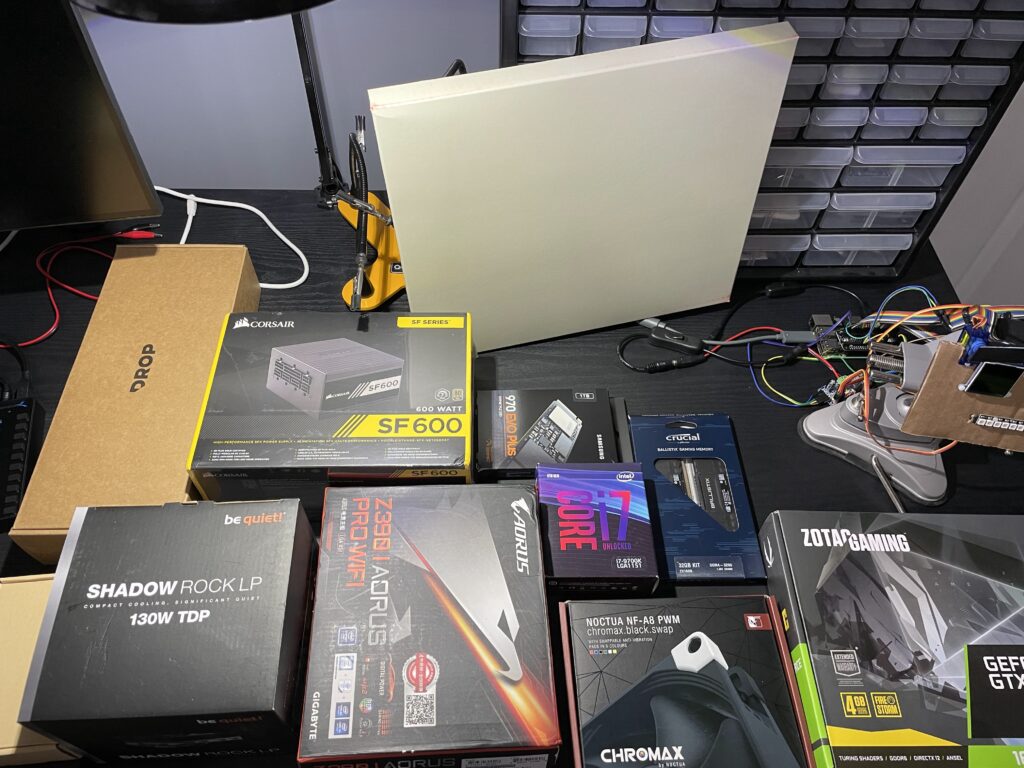
Specs

The parts I went with are modest and didn’t need to be the latest and greatest. The goal for this build was a dependable workbench machine that won’t be my daily driver (iOS development pays the bills), nor replacing my gaming PC.
Augmented Airality
A project from a few months ago:
— Tanner Stokes (@TannerStokes) March 18, 2022
I wrote a macOS app that put particles on the screen to show air quality levels. A few floaters? You’re fine.
But if your screen looks like this, get out. 😂 pic.twitter.com/r5tniUZzK6
The 64×32 @adafruit Matrix Portal is a great device, just possibly a little too low res for an external macOS screen. #notquiteretina 😆 pic.twitter.com/MUzGMQQ3Xi
— Tanner Stokes (@TannerStokes) February 11, 2022
For this week’s “Nerd Snipe”, I spent way too much time at work trying to track down a pesky bug related to our editor. Long story short, we send some custom NSAttributedString.Keys to signify differences in rich text. For instance, a heading attribute with an integer value may tell a parser to wrap text in an <h2> when converting the string to HTML.
Oddly, sometimes that special attribute wouldn’t be included when text was autocorrected, so the generated HTML wasn’t always what we expected. After a lot of digging I believe this could be a bug in UITextView (or maybe NSTextStorage).
Inspecting the value of attrString in the NSTextStorage function func replaceCharacters(in range: NSRange, with attrString: NSAttributedString) after autocorrecting some text shows that it only seems to include attributes that were defined in Foundation (e.g. NSFont, etc.), but not our custom ones.
Regular typing works fine – you see all the expected attributes set in textView.typingAttributes.
In scenarios like these I like to make the simplest example to help confirm I understand it, so I’ve made a repo demonstrating the issue in case it’s helpful for anyone.
I realize this post may be useful to about three other people in the world, but sharing is caring.
What I wanted to do
On my Windows 11 machine I wanted to be able to write and upload firmware to an Arduino Pro Micro (Leonardo) using PlatformIO.
The standard way to accomplish this is to install PlatformIO in VSCode for Windows and you’re done. However, I’m a bit of long time *nix user and really like my PlatformIO + Git workflow in that environment.
WSL sounds like a great option for this case, but unfortunately from what I’ve read, serial communication doesn’t play too nicely without a bunch of hoops to jump through.
To keep things (somewhat) simple I installed a Linux VM through VirtualBox and added a USB Device Filter for the attached Arduino Leonardo so it would be forwarded and accessible by PlatformIO. Using VSCode as my editor would still be possible thanks to its awesome remote features.
Watch your tabs!
Yay computers!
Because I missed a tab in a Python script, my home Docker box has been running with a higher-than-necessary CPU utilization and spiky temperatures for five months. 😬
Tab has now been tabbed. 🐍


Snake Eyes + Servos
Carve Different

