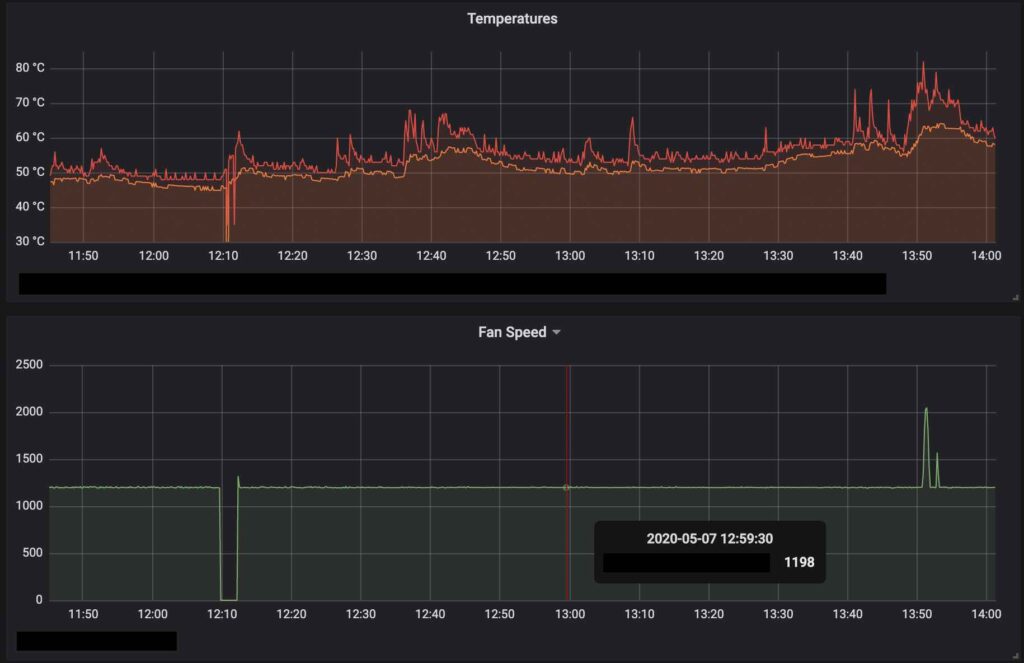
I know I talk about Grafana way too much, but it’s such a cool tool. Installing Telegraf on Linux gets me about 80% of what I want, but on macOS (via Homebrew) it’s lacking even more.
Note: I use InfluxDB as my Telegraf output.
The Telegraf part
To get values for my Mac’s CPU temperature, GPU temperature, and fan speed, here’s what I did:
- Install iStats: https://github.com/Chris911/iStats
- Add the following executable inputs to Telegraf’s config in
/usr/local/etc/telegraf.conf
# CPU temperature from iStats - https://github.com/Chris911/iStats
# Note - this would need to be adjusted for multiple CPUs
# Key was discovered as TC0P
[[inputs.exec]]
commands = ["/usr/local/bin/istats cpu --value-only"]
timeout = "5s"
name_override = "cpu_temperature_mac"
data_format = "value"
data_type = "float"

# GPU temperature from iStats - https://github.com/Chris911/iStats
# Note - this would need to be adjusted for multiple GPUs
# Key was discovered as TCGc
[[inputs.exec]]
commands = ["/usr/local/bin/istats scan TCGc --value-only"]
timeout = "5s"
name_override = "gpu_temperature_mac"
data_format = "value"
data_type = "float"

# Fan speed from iStats - https://github.com/Chris911/iStats
# Note - this would need to be adjusted for multiple fans
[[inputs.exec]]
commands = ["/usr/local/bin/istats fan speed --value-only"]
timeout = "5s"
name_override = "fan_speed"
data_format = "value"
data_type = "integer"
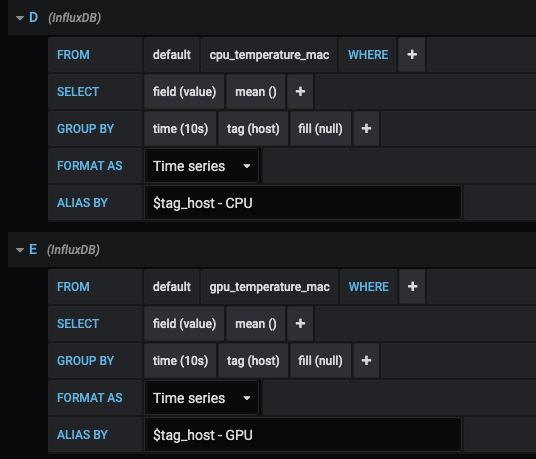
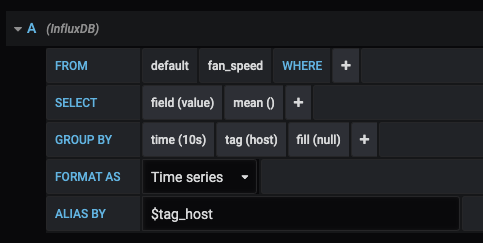
The Grafana part


Some caveats to this approach:
- This was on a 2019 i9 iMac with a single processor, GPU, and fan and won’t automatically work for all machines. You’d need to run iStats to see what all keys and values appear for your particular Mac.
- It would be better if the CPU and GPU stats all played nice with the same measurement names Linux uses so we wouldn’t have to have multiple Grafana queries. I may do this in the future, but right now this was easy to implement with my RPi, PC, Mac, and Linux boxes.
